In the last few blogs in our Alternative Execution Macro Saga: (part 1 – InkPicture & part 2 – WMPlayer) we worked through scenarios making use of the ActiveX controls InkPicture and WMPlayer to trigger macro execution. Macro execution utilizing these objects can be achieved without resorting to the more common Document_Open() or Workbook_Open() event handlers available to Microsoft Word or Excel and can be used to bypass prevention controls that alert on malicious documents (maldocs) making use of either event handler.
In this part 3 blog, we’ll cover one additional ActiveX control that can be embedded via Microsoft Office UIs to achieve macro execution without resorting to Office applications’ Open() handlers. Although this control has the fewest available event handlers, the effort involved in configuring the control and identifying the correct event handler isn’t so bad.
Performance Monitor
Microsoft includes a performance monitoring tool that can be loaded via Microsoft Management Console (MMC) Snap-in, or directly by searching for the tool from the Start menu. This tool has been with Windows for a long time, as far back as Windows NT 3.1. It’s evolved over time; however, the user interface should be fairly familiar to those of us who have been working in technology for a while.
According to Wikipedia, this tool has had a few name changes. It’s gone back and forth between Performance Monitor and System Monitor throughout the years, with Windows Vista bringing back the name of Performance Monitor that we see now.
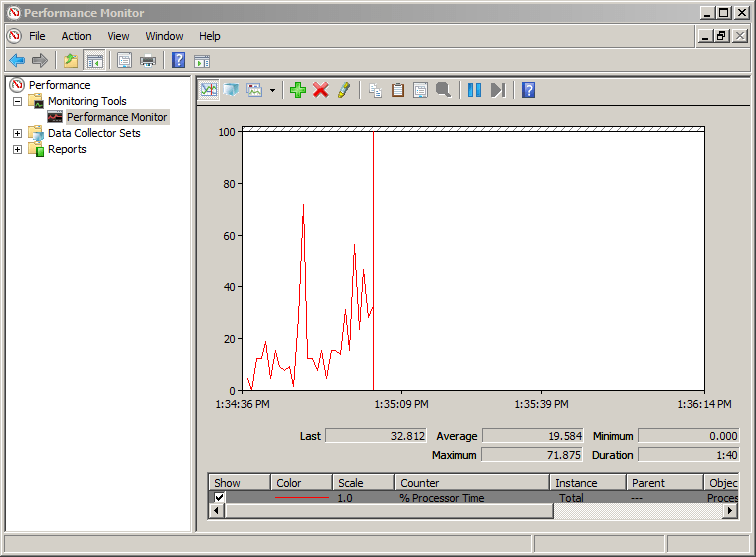
It’s unlikely that this tool will be leaving Windows operating systems in the near future, largely due to its long history. And although Windows 10 has a more modern Performance Monitor tool, this is still available if you search from your Start menu or import the snap-in via MMC.
The Performance Monitor can be configured to monitor a variety of system details (or counters) such as CPU, Disk, and Network usage with varying degrees of granularity. When I was a fairly regular Windows user, I actually made use of this tool to monitor performance issues on my systems.
System Monitor
What a great tool. It’s so great that you can embed it in Microsoft Office apps! Let’s follow the steps we’ve taken in the previous blogs to do this. Let’s open Word and select the Developer tab. In the Developer tab you’ll see a toolbox icon in the Controls submenu:
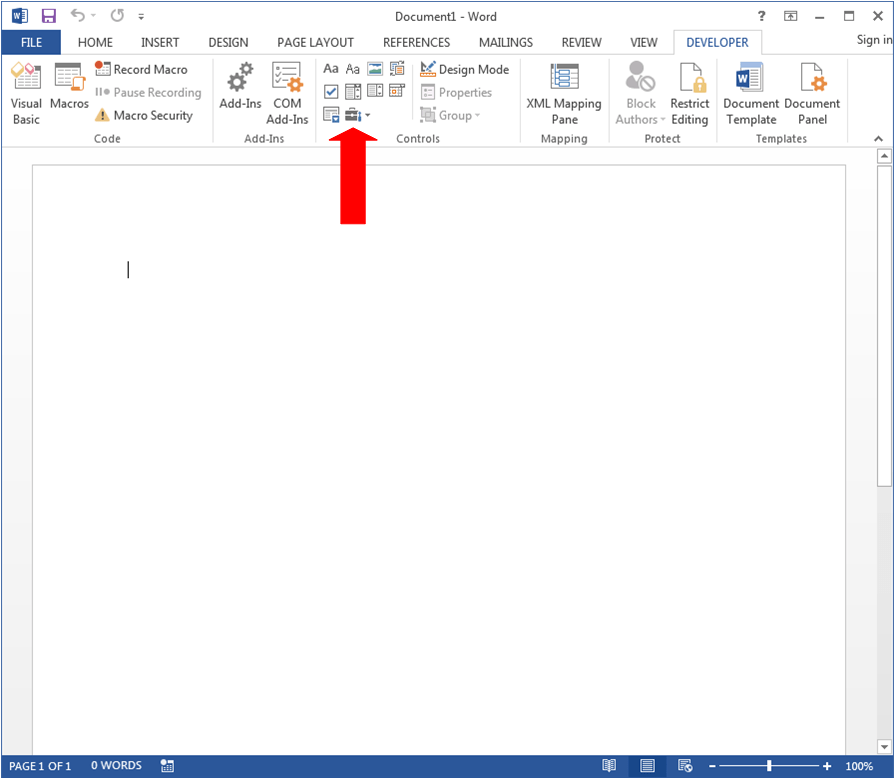
After you click the Toolbox icon, you’ll see a submenu containing Legacy Forms and ActiveX Controls. Then within the ActiveX Controls section, you’ll find an icon of a screwdriver and wrench.
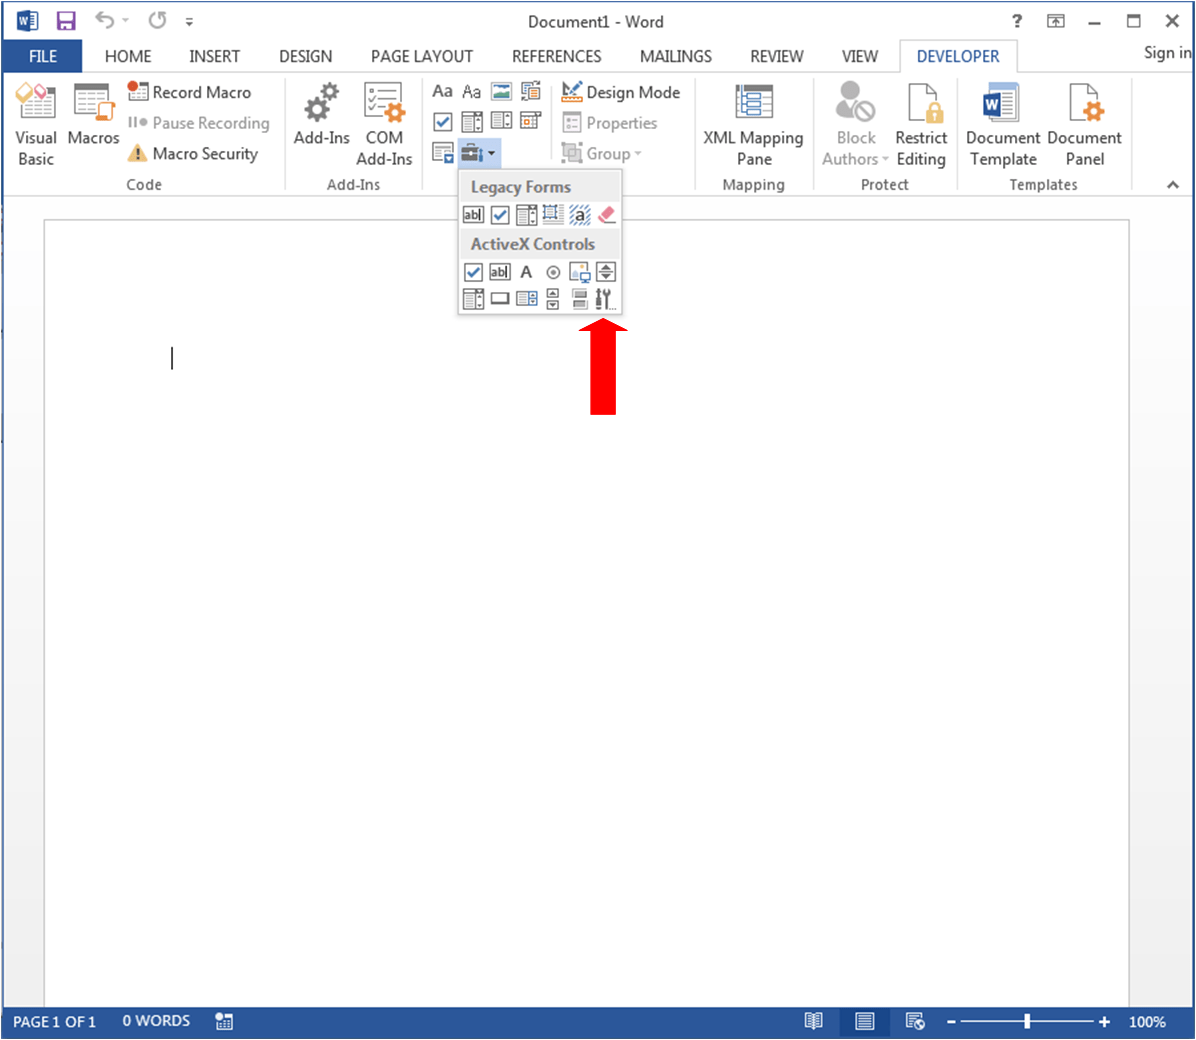
After you click that screwdriver/wrench icon the list of embeddable ActiveX controls will open.
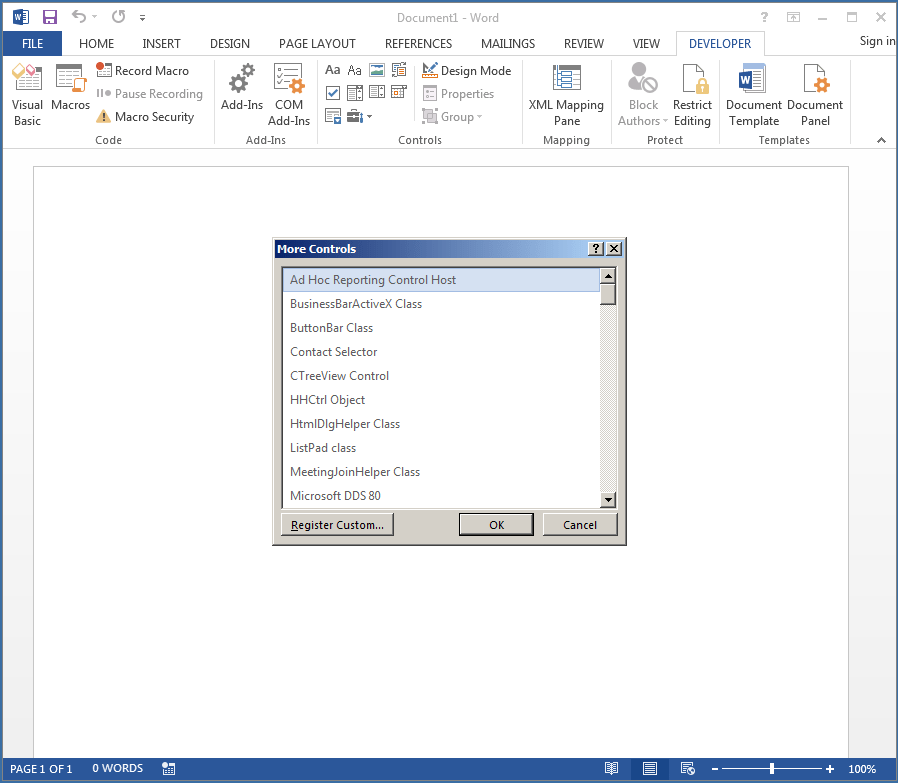
And then we’ll scroll down the list to find the System Monitor Control (Sysmon):
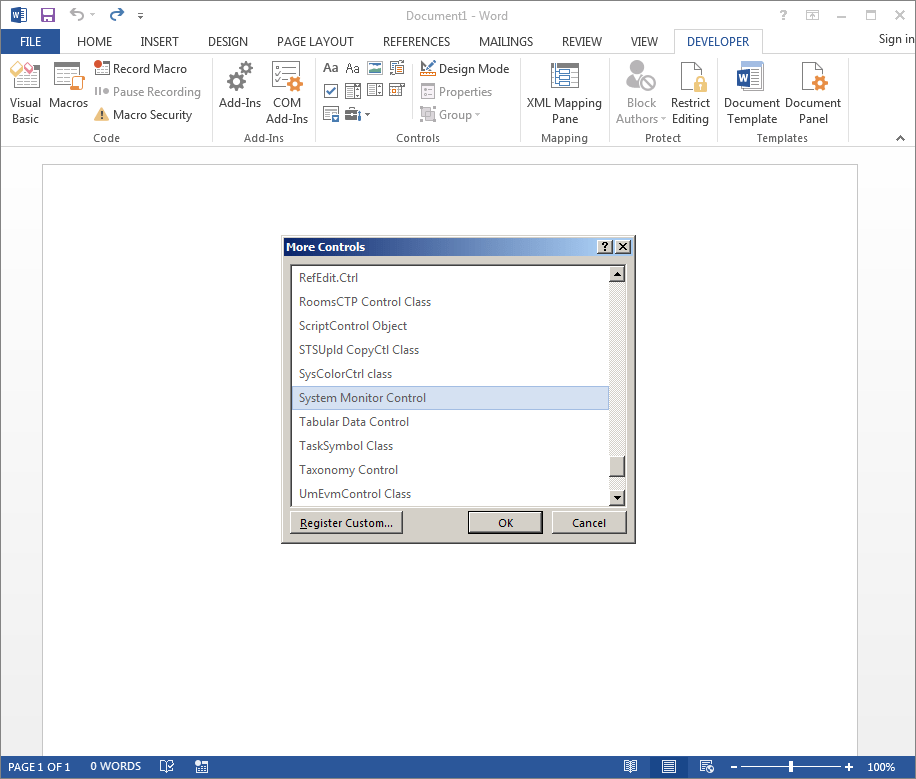
Then we’ll click OK to insert the control.
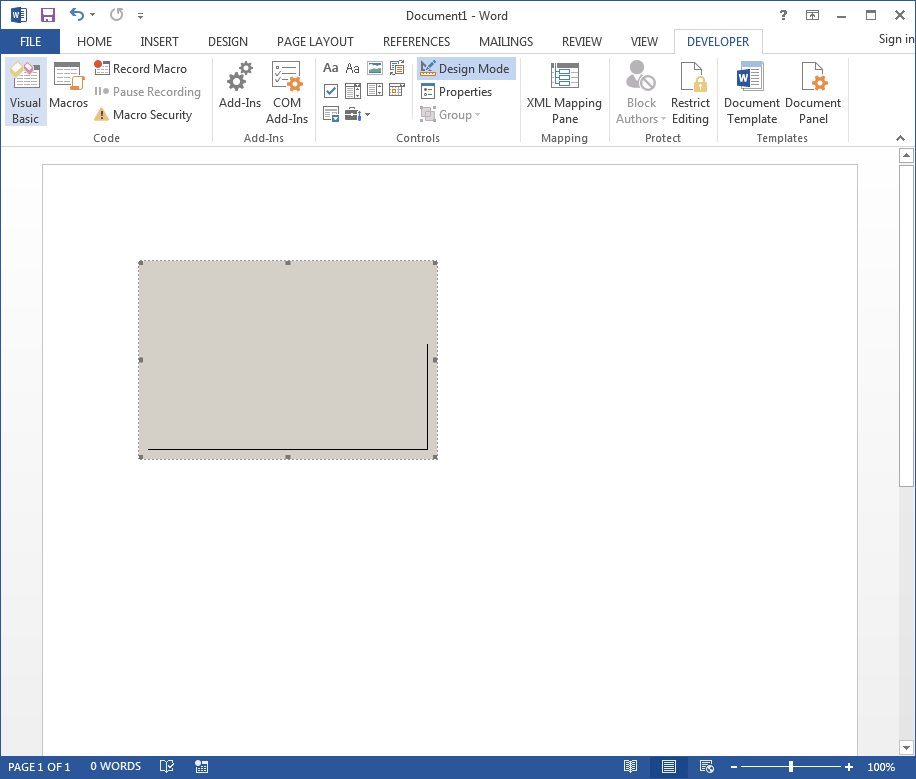
As we’ve mentioned in previous blogs, you’ll want to note that you’re currently in “Design Mode” and can resize this control if you please. Let’s do that now!
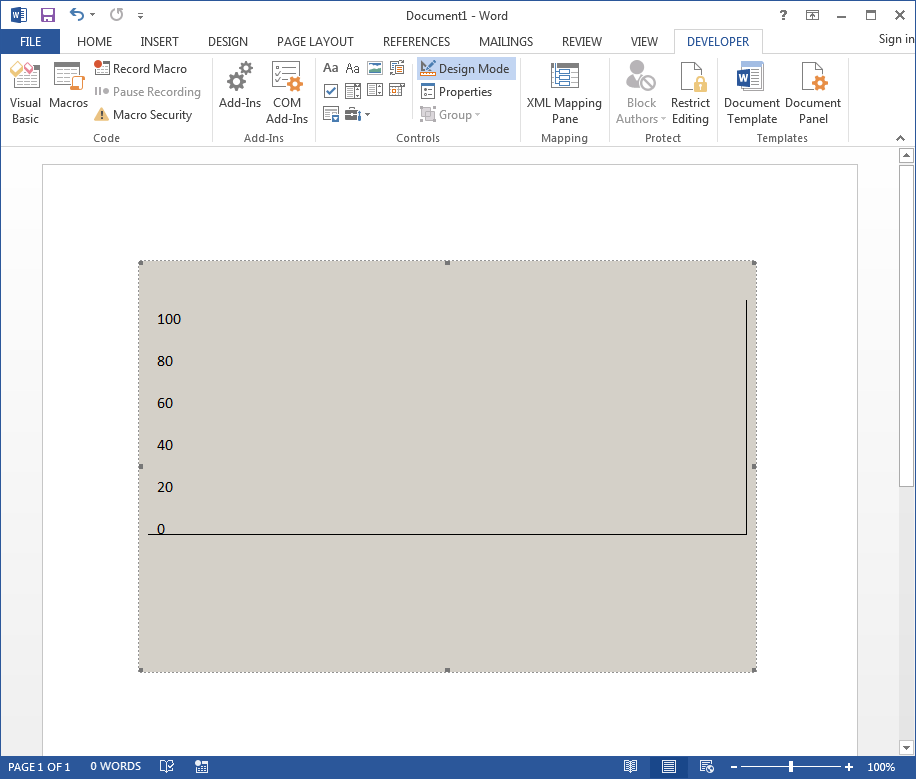
Now that we have the object embedded, and played around with resizing it, let’s disable “Design Mode” mode to see what it looks like.
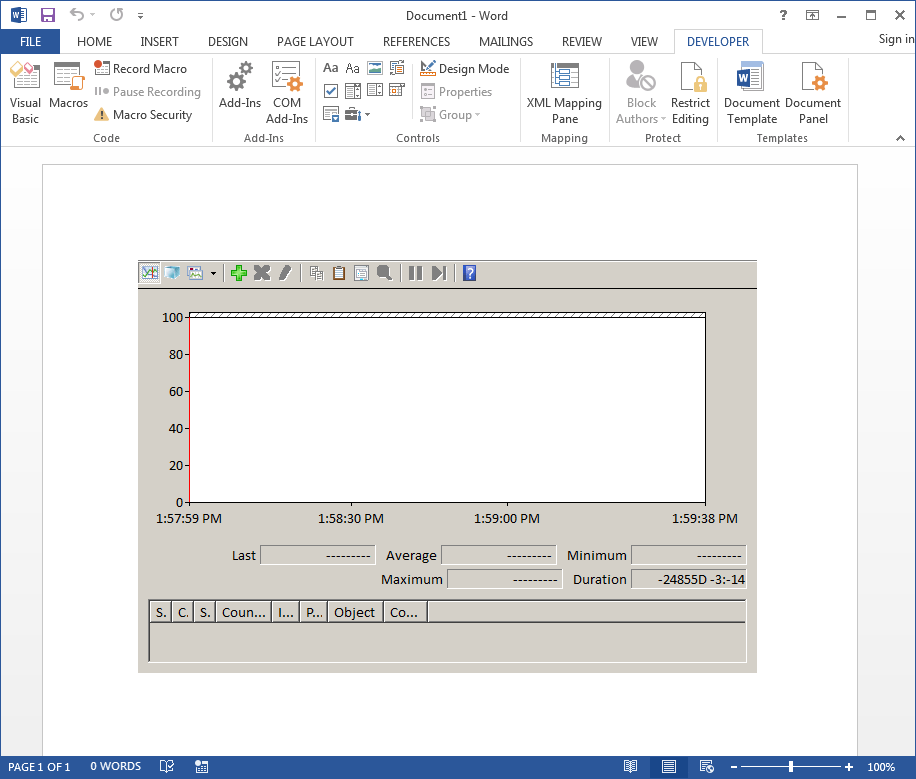
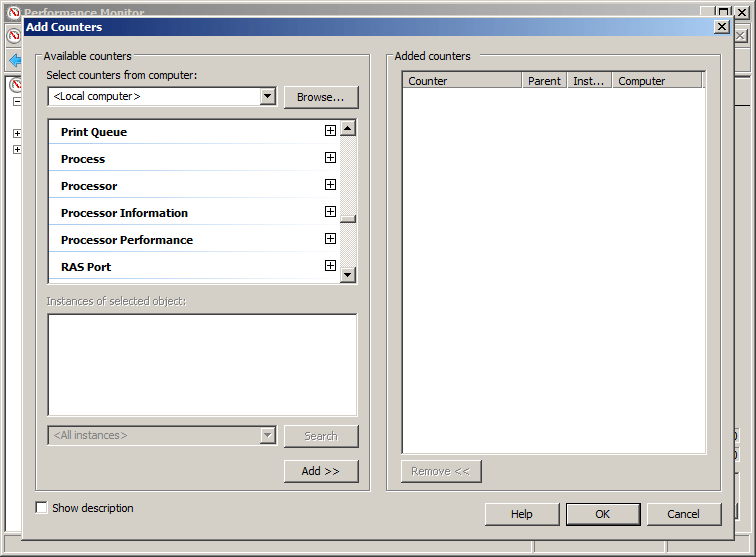
That looks like our Performance Monitor window, but there’s no graph. To remedy this, we’ll want to add some counters. There’s a green + symbol on the control, let’s click this and select a counter.
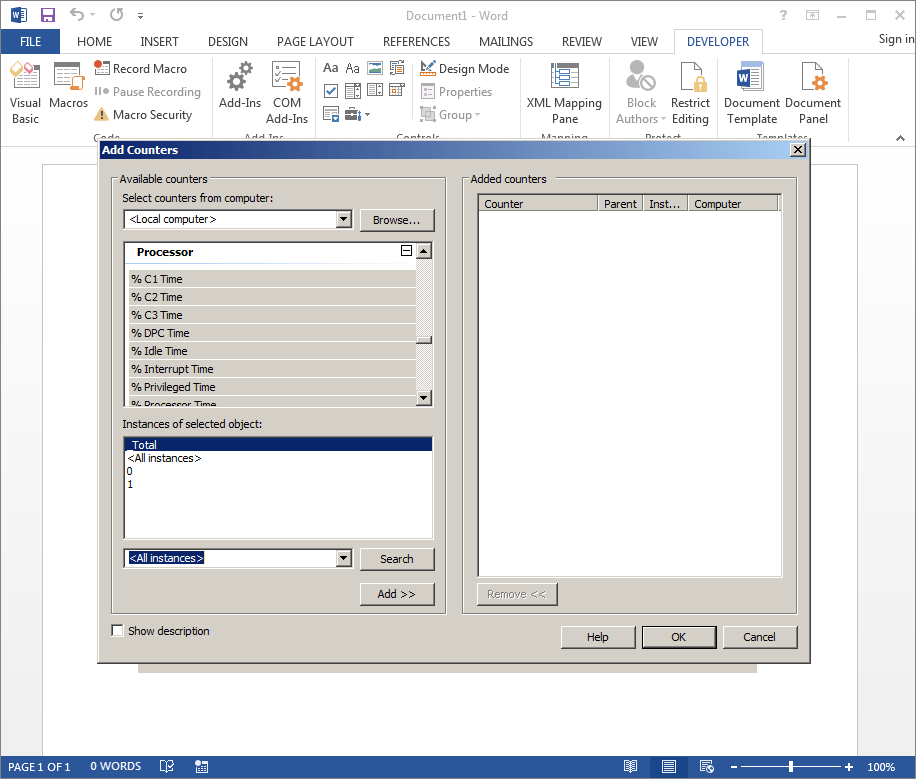
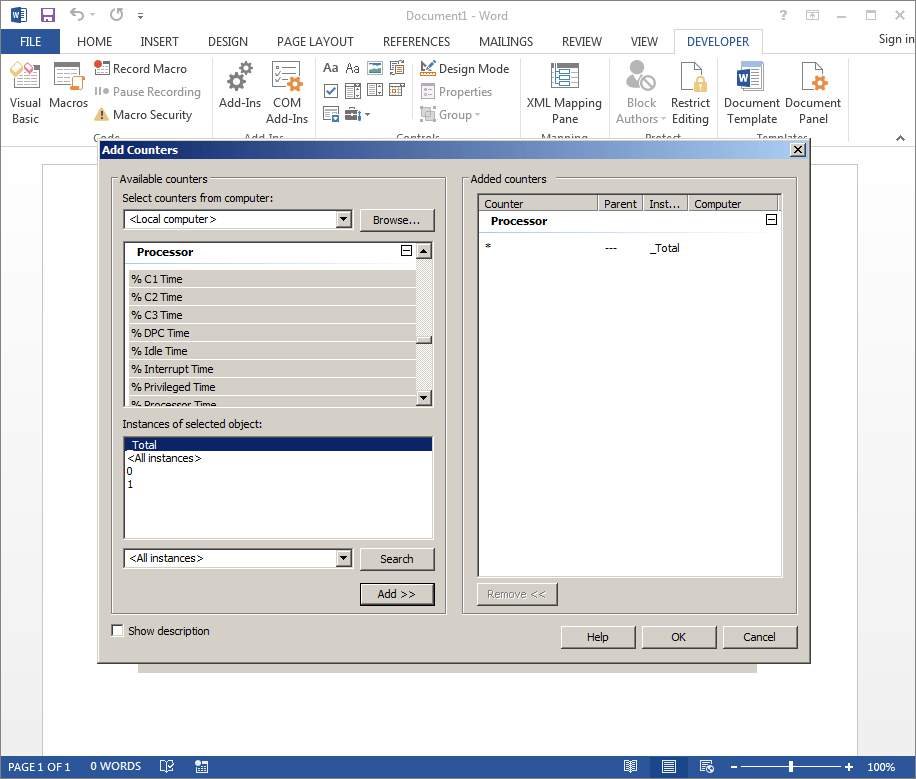
We’ve selected the Processor counter, with default settings. Please note the highlighted <All instances> section on the lower left-hand side of the control. This needs to be manually selected prior to clicking the “Add > >” button, or else the counters won’t be pulled correctly. So let’s click that button to see what this should look like.
Now we can click OK to return back to Word and view the results of our configuration.
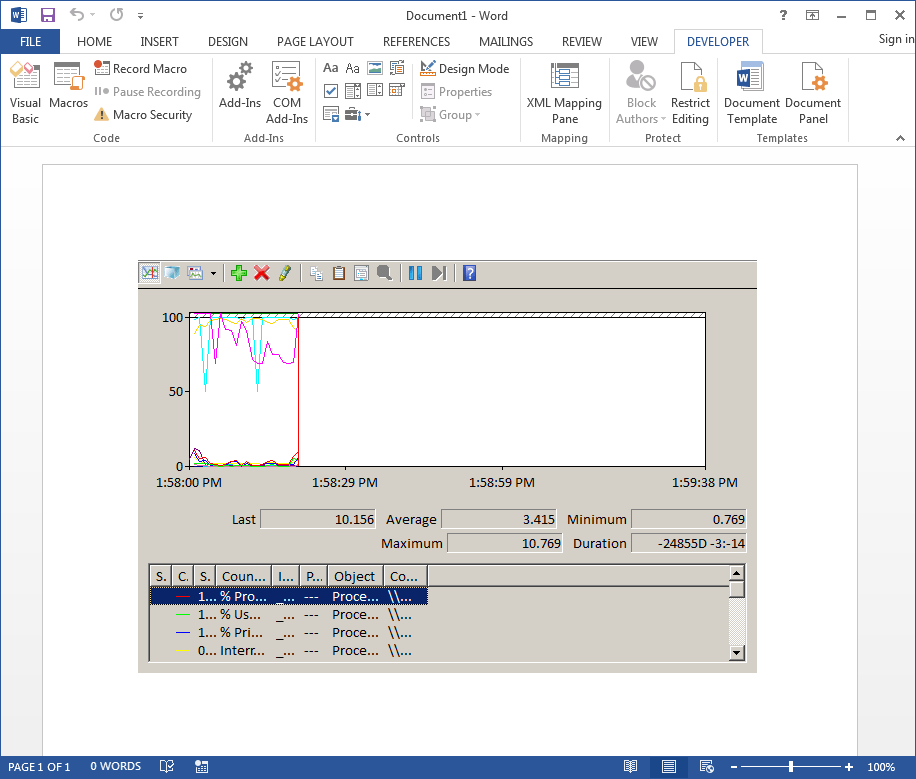
Now that looks more like Performance Monitor. Let’s save this as a macro-enabled file named Sysmon.docm. We can keep it open since the next few steps will be quick.
About System Monitor
When I originally started testing this control it was late at night. I was tired and wasn’t focusing very well. I completely missed the documentation Microsoft produced for this control, and instead figured out how to abuse an event handler the manual way. Since each ActiveX control has both a CLSID (GUID) and ProgID (friendly program name) associated with it, System Monitor Control’s details are:
- CLSID: C4D2D8E0-D1DD-11CE-940F-008029004347
- ProgID: Sysmon (Sysmon.3)
Although reading the documentation is the most straightforward way to get to the solution, I’ll take you through the usage of a tool called oleviewdotnet, another excellent tool written by James Forshaw of Google’s Project Zero. This tool was written to assist with reverse engineering COM/ActiveX objects and their capabilities and is exactly what we need to identify the functionality of Sysmon.
This tool can be downloaded and built-in Visual Studio, or downloaded as a compiled binary from the GitHub releases tab. Personally, I just use the release version, but the source code is pretty useful if you want to learn how to load arbitrary COM classes and walk through their interfaces.
After downloading/extracting the tool, let’s open it up. You’ll notice that it scans for registered COM classes (via the registry) on your system each time you open the tool. Once it’s fully open you’ll see some basic metrics for what it found.
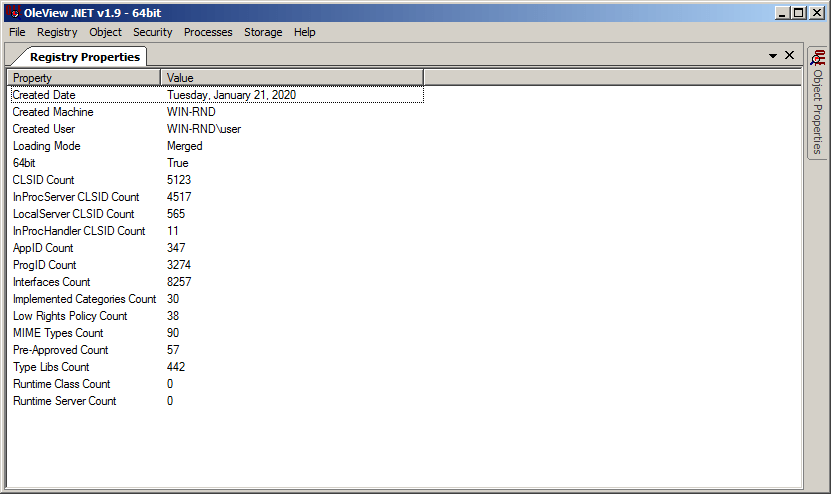
That’s a lot of COM classes, regardless of how you slice it (e.g. CLSID Count, ProgID count). But we’re after something specific, details about the Sysmon class. Although I’ve provided you the CLSID and ProgID above, I didn’t know what they were at this point. So I clicked the “Registry” menu, and then selected the “CLSIDs By Name” option.
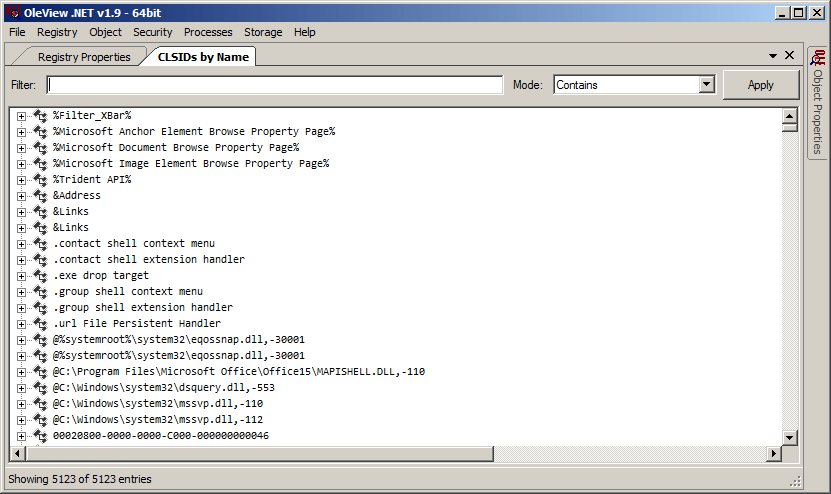
In the “Filter” text box I typed in “System Monitor” and clicked the Apply button.
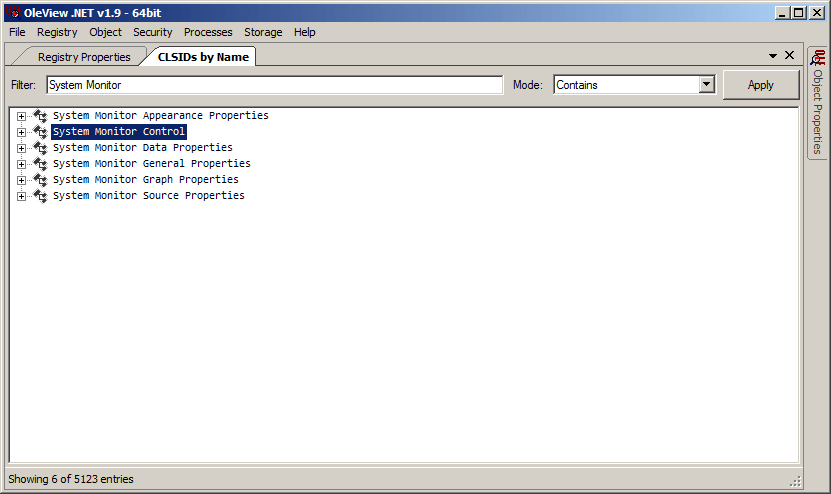
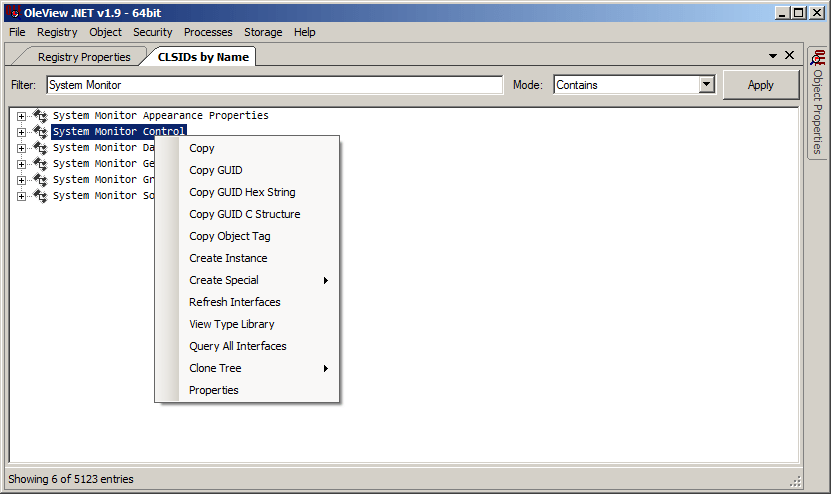
As you can see above, there are a few registered classes with the name of “System Monitor”, however, there’s only one with the name of “Control” in it. That’s the one we’re interested in. Next, we’ll right-click that class and select “Properties” from the submenu that opens.
Here we can see both the CLSID and ProgIDs associated with the COM class. Depending on how you go about instantiating an object, you could use either the CLSID or any of the ProgIDs.
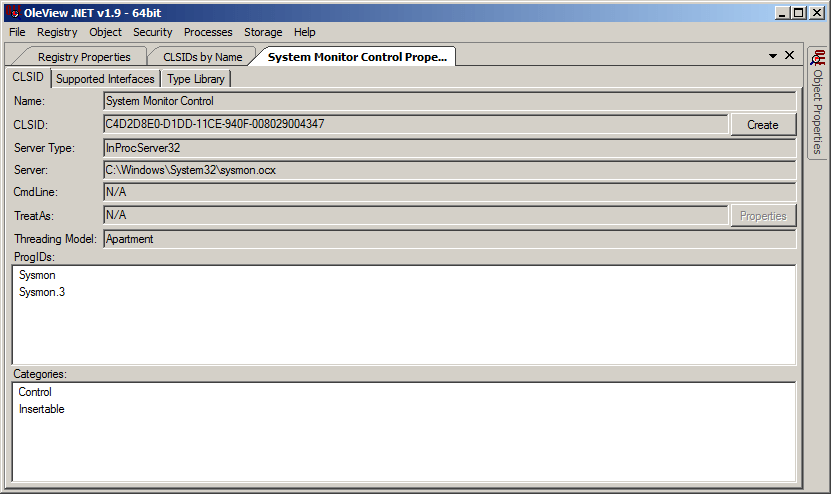
Now let’s close this tab and return to the “CLSIDs by Name” search results. Let’s right-click the “System Monitor Control” and select “View Type Library” from the submenu that opens.
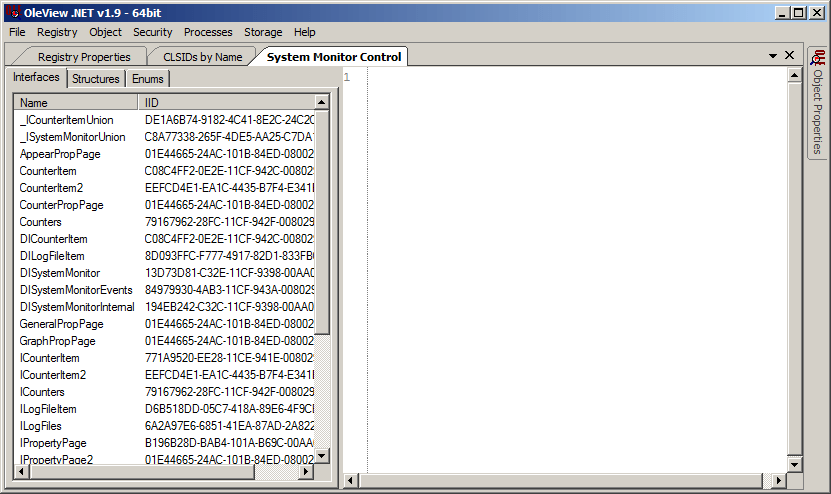
What you’ll see next is a list of COM interface classes associated with System Monitor Control. Since we’re interested in events, let’s narrow our focus on DISystemMonitorEvents.
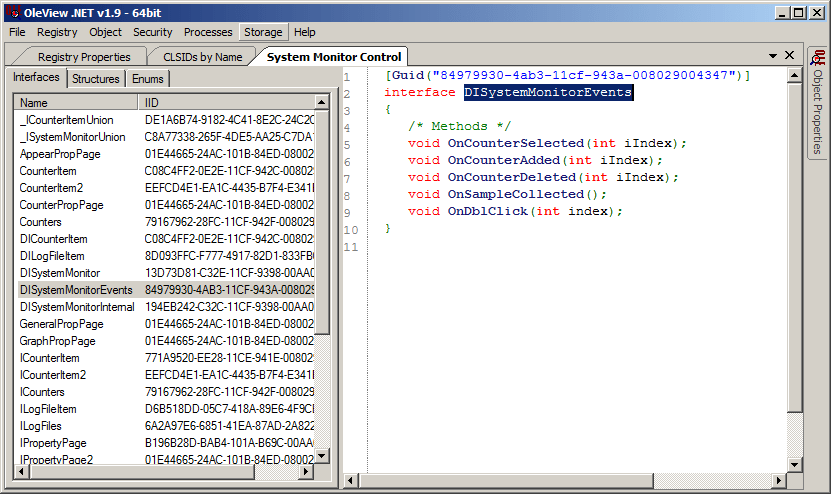
This looks like what we’re looking for. But it looks like most of the event handlers are associated with Selecting/Adding/Deleting a performance counter. OnDblClick() would only be triggered when the control is double-clicked. But the OnSampleCollected() event handler looks interesting. In fact, this is the handler that’s usable for our purposes!
Let’s jump back to our Word document. Under the developer tab, let’s click “Design Mode” and then double-click the embedded control to bring us to the VBA Editor. In the editor, we can see the event handler that Word populated for us.
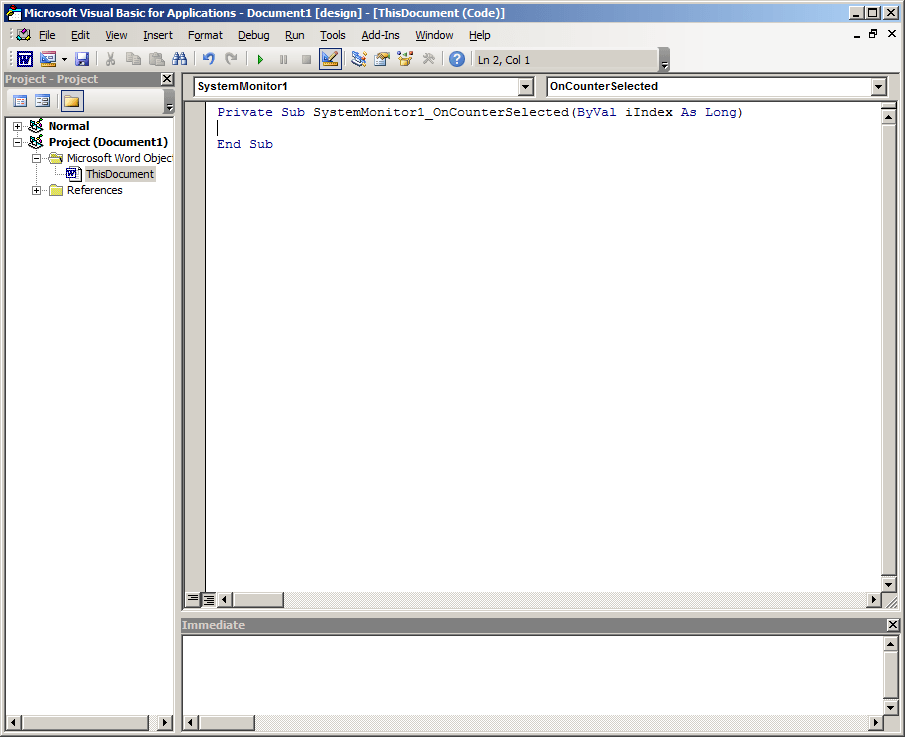
It’s the OnCounterSelected() event that we saw in oleviewdotnet. Since we really don’t care about this event, let’s change it to OnSampleCollected(). We can see in oleviewdotnet that the argument list for this handler is empty, so let’s make sure that it’s reflected in VBA. Also, this event fires literally every time a performance counter is collected. If we don’t control its execution we’ll either have to kill Word or deal with a race condition between our MsgBox() popup tests and selecting the pause button on the control. Let’s make the following macro to test this event handler.
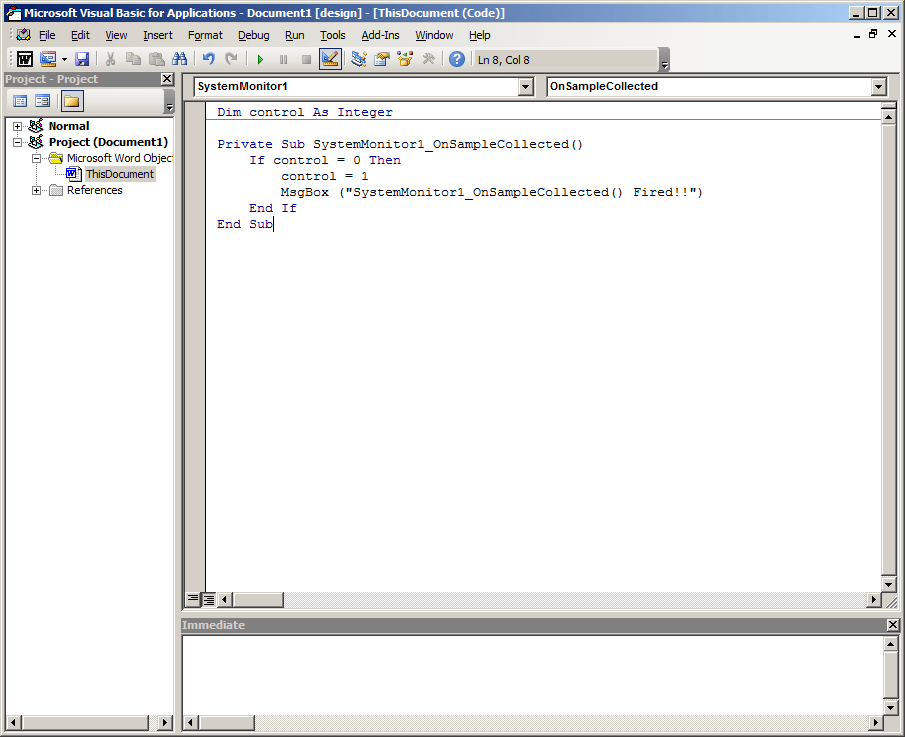
Now that we’ve created this macro, let’s close out the VBA Editor, and click “Design Mode” on the Developer tab to reenable our Sysmon control.
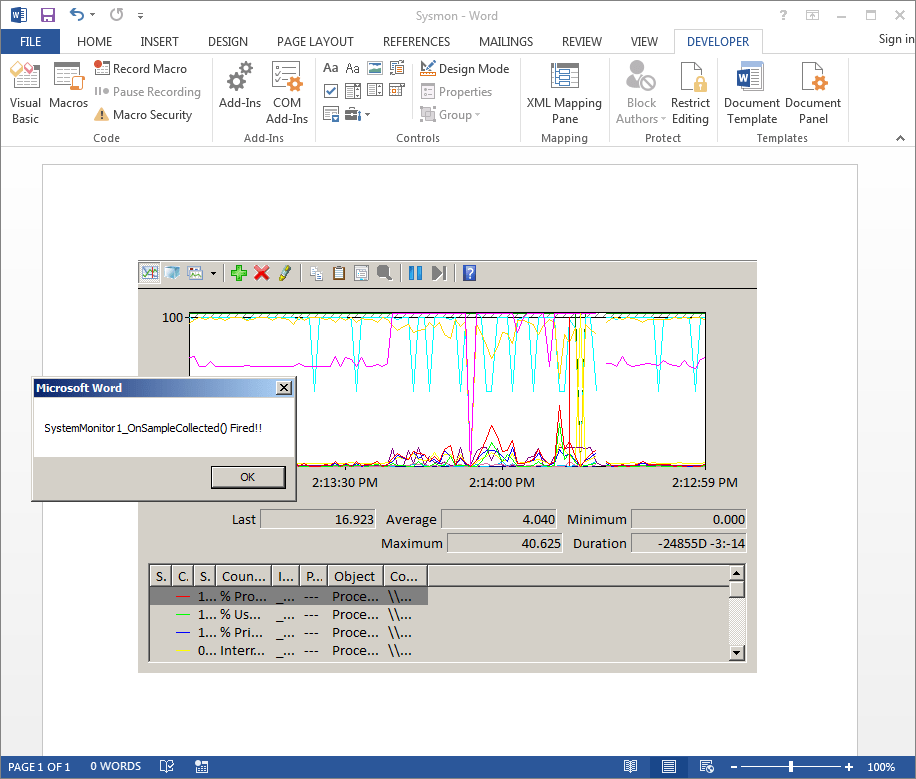
And almost immediately our event handler was triggered. After selecting OK the event will continue to be triggered, however, we won’t receive any additional popups because we’re controlling the execution of the MsgBox() statement. The last step is to save our document and reopen it. We’ll see the familiar “Security Warning” related to our embedded ActiveX object.
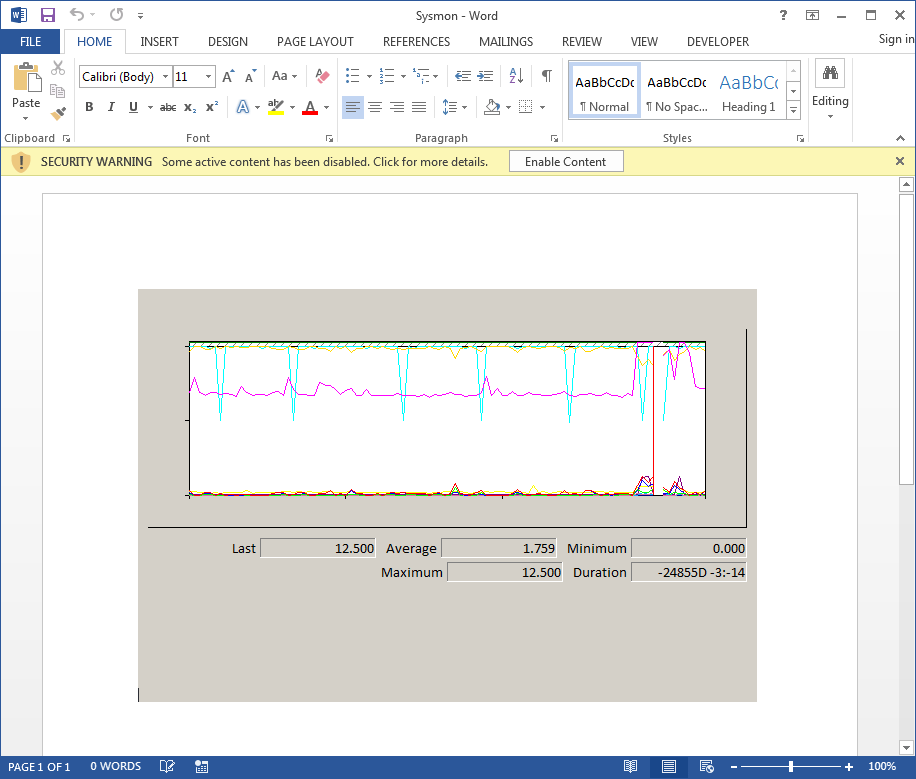
Once we click “Enable Content” our event should fire.
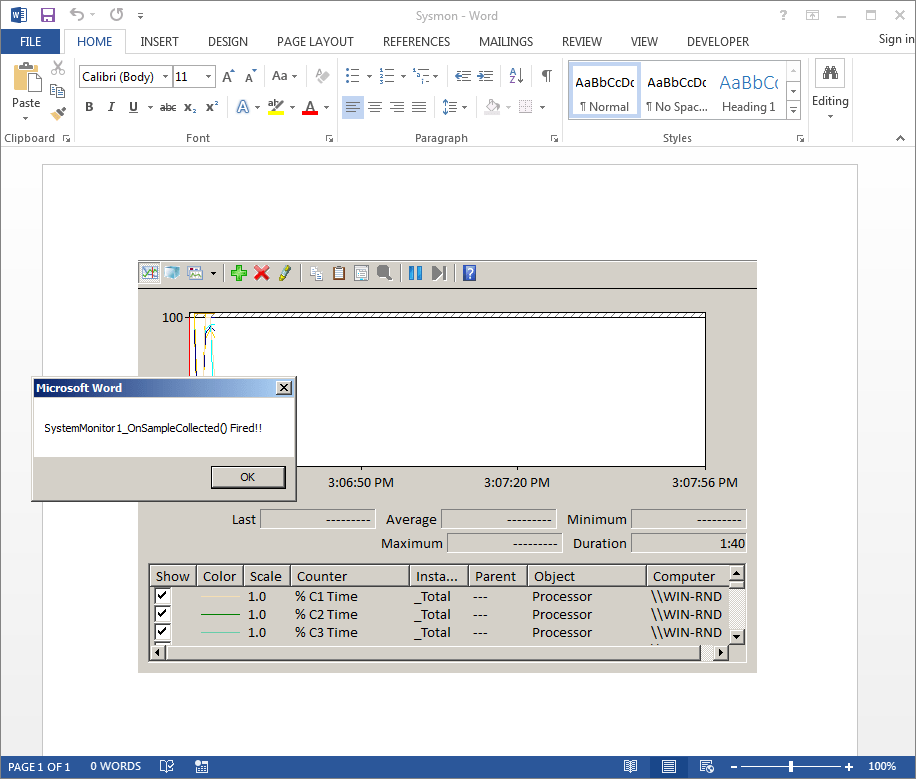
Fantastic!
Additional Performance Monitor / System Monitor Remarks
Reference documentation for Microsoft’s technologies isn’t always the easiest to find. In fact, there are some cases where the documentation simply doesn’t exist. When searching for System Monitor Control’s documentation if I spent maybe 5 more minutes, I wouldn’t have needed to use oleviewdotnet. But the tool is great, and when I made use of it to review InkPicture and WMPlayer controls it was actually much more efficient than looking through Microsoft’s documentation. In reality, both were extremely helpful in constructing this proof of concept.
Also, if you’re looking at any of these examples, and wondering how anyone could be convinced into clicking “Enable Content” on the associated maldocs, you can actually shift both WMPlayer and System Monitor Control to the second page of a maldoc, and use an appropriate lure on the main page to trick a potential victim. The only control that needs to have a focus in these examples is the InkPicture control. And when making use of an appropriate lure, InkPicture can sit atop the lure so it has focus that’s required to trigger its event handlers.
Performance Monitor Wrap-Up
In this Part 3 blog, we spent the time and energy to craft another maldoc making use of an unconventional automatic execution method: The Performance Monitor ActiveX control (aka System Monitor Control). We also worked through the process I had used initially with both Windows Media Player and System Monitor by making use of the oleviewdotnet tool to enumerate and research the COM classes associated with these controls. Again, we’ve been able to demonstrate executing VBA code that doesn’t depend on Document_Open() or Workbook_Open() event handlers that are common with maldocs to obtain automatic execution on target systems.
Although I’ve already stressed this a bit, please consider disabling Office Macros enterprise-wide via GPO. It’s worth noting that you can also disable ActiveX in Office via GPO, so if you have the political ammo to disable macros, you might as well disable ActiveX while you’re at it. I bring this up again now, because if you’re not yet convinced then the next few blogs should be the deciding factor.
And again, don’t forget the popcorn! Continue to parts 4-7 of the Alternative Execution Macro Saga.
